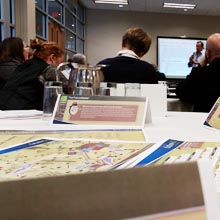
Fox Valley Think Tank Survey Data
The scatterplots presented below explore the expectations and preferences of the participants of the December 8 and 9 Fox Valley Regional Collaboration Think Tank on the future of Industry Diversification and Regional Collaboration in the region. The filters included allow you to identify the preferences of stakeholders in each of the five counties in the region, by organization type, as well as an individual's specific preferences. This information has been used to develop a clear image of the region's preferred future.
Fox Valley Think Tank Survey Data Scenario Planning Maps
Expected Future
The data presented in this scatterplot represent participants' expectations of the future of the region if no changes are made to the local industry mix or models of collaboration. Each participant was asked to identify a specific point within the space of the four plausible scenarios identified. This scatterplot aggregates those predictions.

Preferred Future
The data presented in this scatterplot represent participants' preferred regional future assuming that strategic changes and improvements can be made to the local industry mix and models of collaboration. Each participant was asked to identify a specific point within the space of the four plausible scenarios identified. This scatterplot aggregates those predictions.
Categorical Preference
In addition to identifying specific points within both the expected and preferred scenario spaces, think tank participants were also asked a series of six questions related to their willingness to change in terms of Industry Diversification and Regional Collaboration. The data in this scatterplot represents the weighted averages of their responses to these questions. Please note that there is a great deal of consistency between the distributions of responses in this space with the predictions included in the Preferred Future Scatterplot.
